As a long-time “arts development” junkie and former arts service organization executive director, I’ve followed Mass Culture’s work for years. I am always interested in the content, and even more so by the way Mass Culture works.
I was especially excited to see the Data Narratives for the Arts project come online. Free training sessions + a paid training opportunity to create your own “data narrative” + a new sector data platform? Yes, please!
The DNA project also coincides with another project I’m involved in: a 2-year research project on “Community Data Empowerment” (CDE) being co-led by the data-loving folks at Creative Coast and Simon Fraser University’s School of Computing Science, including Dr. Sheelagh Carpendale, who gave the opening training for the DNA project.

Data as an essential ingredient for the arts
I am a firm believer that data is an essential and often missing ingredient in the arts and cultural sector. One of the things I came looking for in this talk is what reclaiming our data heritage might mean for the way we work as artists and as arts professionals.
Or, to be more specific: I wanted to see how arts sector folks would react to Sheelagh’s ideas. Would you all feel as excited as me?
If you were at the session, I think you’ll know what I mean when I say I have quickly become one of Sheelagh’s super-fans.
After 20 years of primarily being in the business of evaluating impact and generating “an evidence-based case for support” for various arts and social impact projects in Canada, I consider myself to be at least “data competent.” I can spot, source, analyze and communicate data in ways that create tangible change.
What has changed for me over the last few months working in proximity with Sheelagh and her brilliant team of artists/scientists, is that I’ve been on, in her words, a “data empowerment journey.”
I was a bit surprised the first time she made this comment, but she is right. My technical abilities are still mainly limited to selecting the “sort data” function and building pie charts in Excel, but my brain is fully lit up with the possibilities for data narratives in the arts.
Data + art = love
Ugo Rondinone describes an artist as “someone who brings together information.” I love this definition, especially in the context of data empowerment.
During the session, Sheelagh provided examples of artists who use data as a medium. I love technology, but my human self wants to make things.
Luckily, when it comes to data, there is a big beautiful world out there called “Data Physicalization” that is all about making.
The fact that Data can be ART really resonates with me. It connects data with the human-level impacts our work in the arts creates.

“Tracking our data is part of what makes us human.”
One of Sheelagh’s central messages in her talk, and one that I’ve heard her share before, is the importance of “becoming more active in collecting your own data.”
Sheelagh’s talk and her work have obliterated the “tech bro” stereotype I used to associate with the world of data and computer science. She talks about Data Feminism and introduces data in one of its most relevant and enduring forms: tracking our menstrual cycles.
Data is abundant and it is a medium for all of us in our work as humans, whether we are artists or not. Imagine how powerful menstruating people would be if we gathered and communicated enough of our own data to truly stamp out ridiculous notions of productivity in our culture that ask us to show up in the same way every day of the month, with no built-in space for wellness and rest.
During the talk Sheelagh also gave us an exercise inspired by Dear Data, an analog data drawing project between two friends where they collected, drew and shared their personal data with each other. This is a light-hearted and human approach to data making that I can only imagine must have been immensely satisfying. “A week of complaints and general grumpiness” can only be improved by getting curious about it and sharing it in solidarity, right?

Step away from the computer
If there is one thing I find exciting that I did not know before it is that data work does not have to mean sitting in front of a computer.
Finding, analyzing and communicating data takes effort. Let’s make it easier by starting with something a little more enticing than an Excel bar chart.
In “Reclaiming our data heritage” we heard about a data session using potato printmaking. Sheelagh also showed an example of data visualization kits – they remind me of the colourful cubes my kids use in elementary school to learn coding.
Colours are assigned a meaning and the tiles are stacked and moved around in a tactile way. The data becomes immediately visible and real and fun. And according to our expert, this is apparently much more effective as a data empowerment tool than working in the computer-focused way that we too often default to.
“We are disconnected from data”
How can we begin, in small ways, to make data part of our every day?
If you ask me to spend even more time in front of a computer, I may scream at you. Not actually, but you know what I mean.
Creative Coast provides this description of data empowerment, using the idea of “reclaiming”:
“Data reclamation means coming up with human-centric ways to tell the story of the value of creativity in our lives and community economies. This process aims to remind us that we have a rich heritage as data stewards.”
“Technology plays a cool role in this project – our team aims to explore human-centred tools to make data gathering less tedious and more pleasurable.”
In the CDE project we’ve talked jokingly/not jokingly about a “frustration index” for artists (especially equity-denied artists), with data collection methods akin to how many times you want to bang the table in frustration about the barriers in the work.
What type of medium might be good for capturing a tangible mark each time you feel frustrated about a grant funding decision, a failed partnership, a computer malfunction or institutional racism? What is the shape of each of those marks? What will they tell you when you look at them over a period of time? And who will you show them to?
(I bet if you mailed them to Sheelagh or the lovely crew at Mass Culture, they would be delighted.)

What is your data making project?
In my own work, I expect to continue parsing data found in spreadsheets, policy documents, legislation, interview transcripts, public opinion polling and the like.
I’m thankful that my data empowered self also knows a lot more about what to ask for from the world of data scientists, coders, information visualization and interaction design.
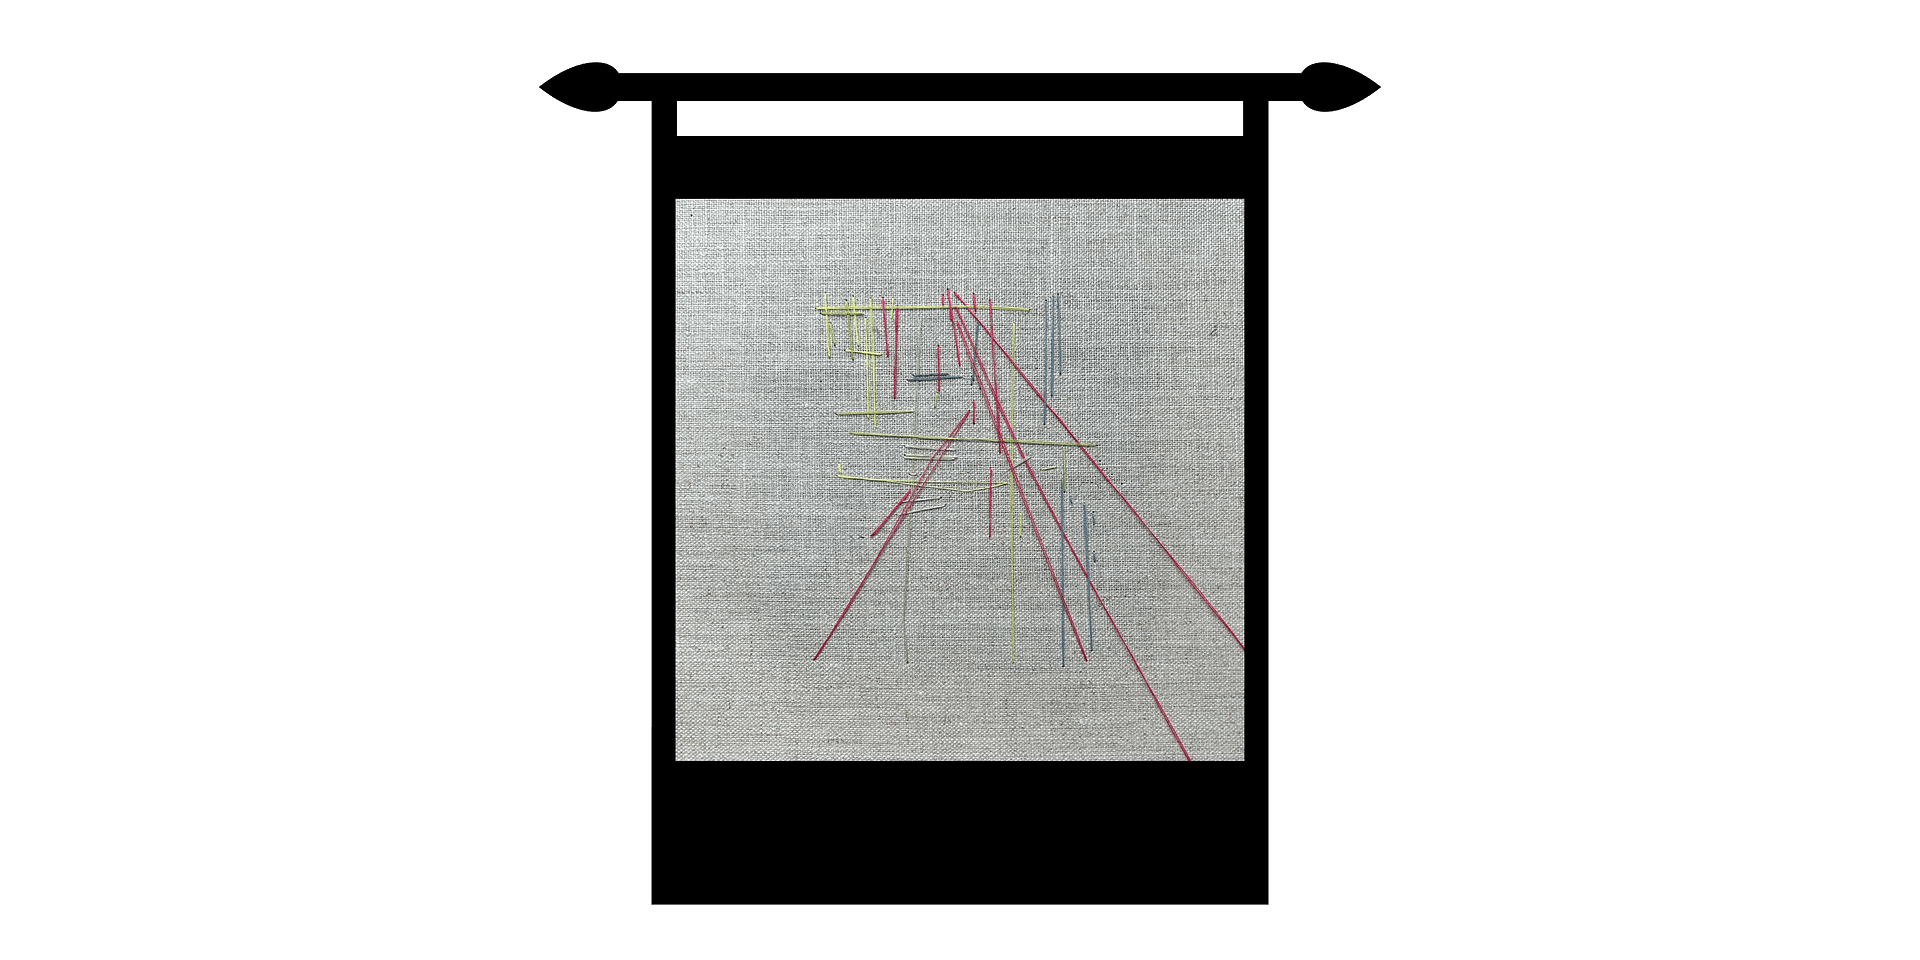
But where I think I am learning the most is from my experiments with data as art. Data embroidery as a way to think about the amount of time I’m spending on Zoom and the impacts on my mental health and creative brain. Accumulation drawings to track my own “frustration index” as a working parent.
Highly therapeutic if nothing else. Also plenty of material. 🙂
Perhaps I will start my own Dear Data project and find one of you to send postcards or embroidery to. You might expect topics such as “Fruitless hours spent negotiating sock-wearing with my 6-year old,” or “Exhausted evenings spent in a Netflix coma instead of at the studio,” or “Number of clients who want to talk while we weed my garden instead of having Zoom meetings.” (Current answer for the latter = 1!).
